Difference between revisions of "Depicting a cloud of observations on a tilt series"
| Line 6: | Line 6: | ||
== Depict a static cloud of point == | == Depict a static cloud of point == | ||
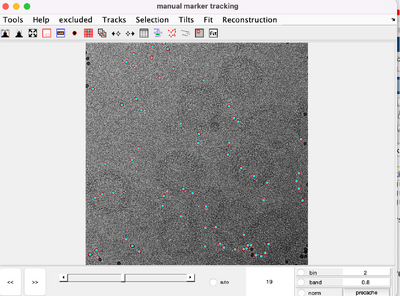
| − | dmarkers <br> offers the possibility of showing a static [[ | + | dmarkers <br> offers the possibility of showing a static [[Clouds of points defined on a tilt series (format)| cloud of points | ]] defined on a tilt series. |
<code> gui = dmarkers(myStack, 'staticCloud',myCloud); </code> | <code> gui = dmarkers(myStack, 'staticCloud',myCloud); </code> | ||
Revision as of 09:08, 8 July 2023
There are several ways of depicting a cloud of points on a set micrographs.
Contents
dmarkers
dmarkers is the GUI that appears as exploration tool for tilt series when running alignment experiments. It can also be used independently of those workflows.
Depict a static cloud of point
dmarkers
offers the possibility of showing a static cloud of points | defined on a tilt series.
gui = dmarkers(myStack, 'staticCloud',myCloud);
Show a set of markers that can be manually edited on screen
Depicting a set of markers on a tilt series, when those markers are organized as a .dms file.
gui = dmarkers(myStack, 'staticCloud',myCloud);
Changing the colors programmatically
The graphic objects that represent the points are governed by the depictor objects that are stored in the gui object that you recover into the left hand side. Inside this gui, the shapeSetManager
gui.shapeSetManager.depictors{1}.hPoints.MarkerFaceColor ='c';
dtmshow
With the GUI
In dtmshow, you can use the import option of the GUI to load a
Programmatically
When invoking the code, you can use the flags cloud and colormapCloud to pass a cloud an its color
